Latest Articles

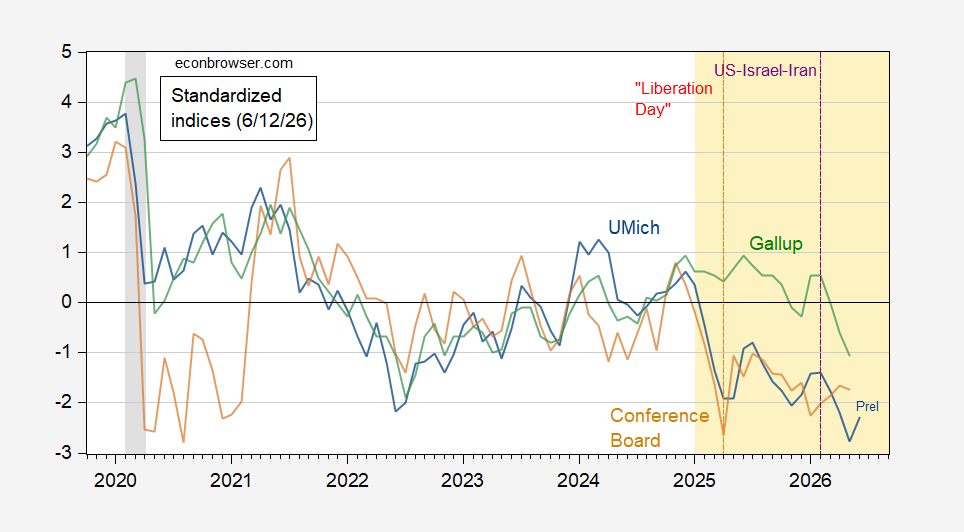
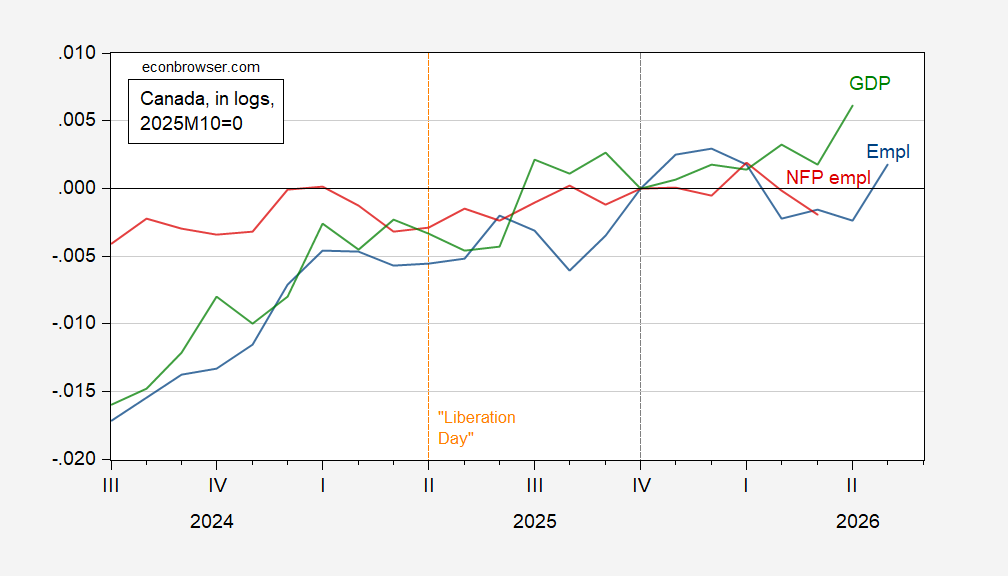
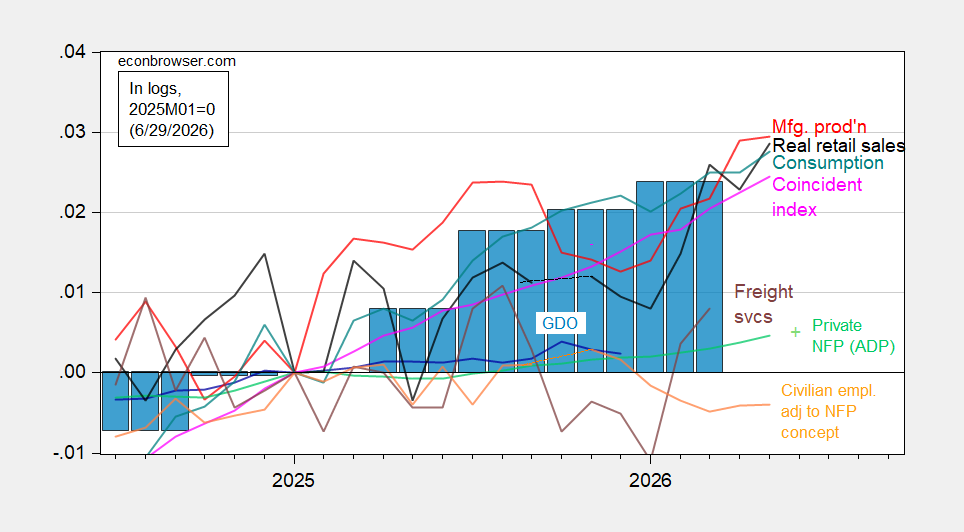
Alternative Business Cycle Indicators: Coincident, Consensus ADP
0
4
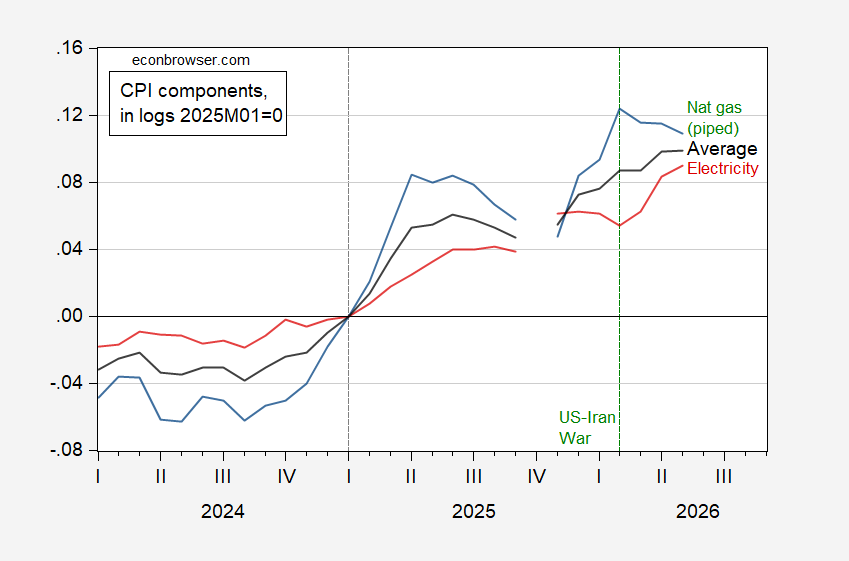
EJ Antoni: “E.J. Antoni: U.S. utility prices down 1.5% since Iran war began”
0
4
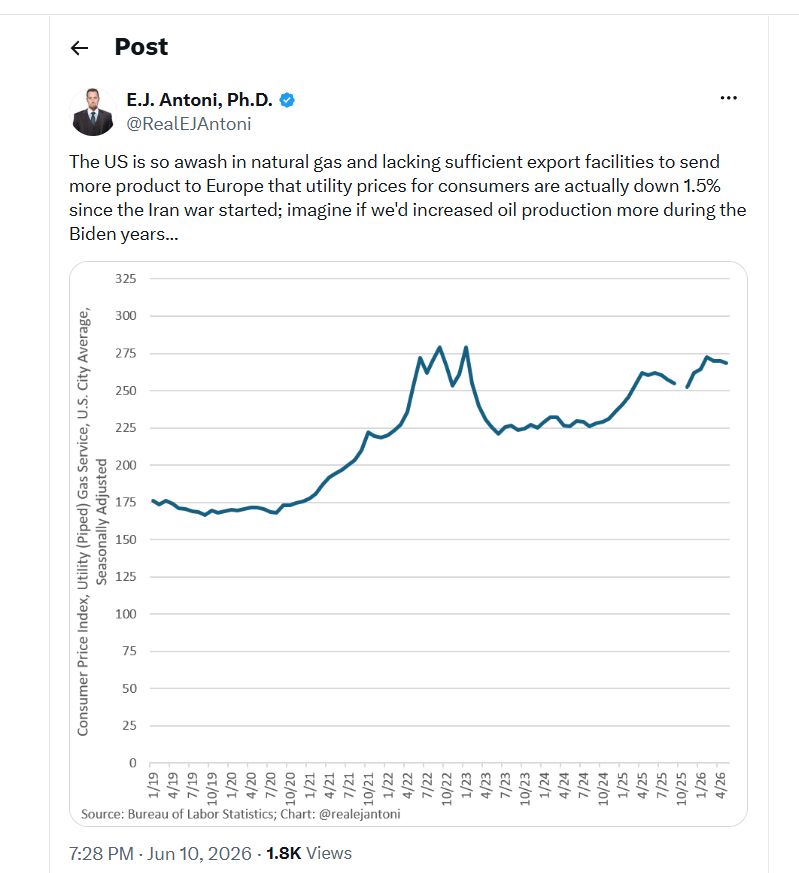
Imagining: Would a Biden “Drill, Baby, Drill” Regime Have Mitigated a Iran-War Induced Cost-Push Shock
0
3
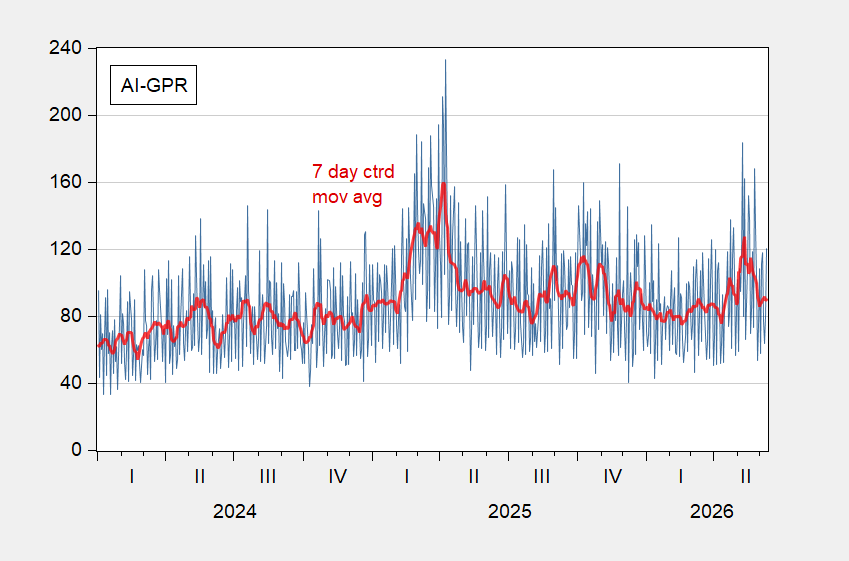
Invaluable New Geopolitical Risk Indexes: AI-GPR, GPR-Oil, and More
0
3
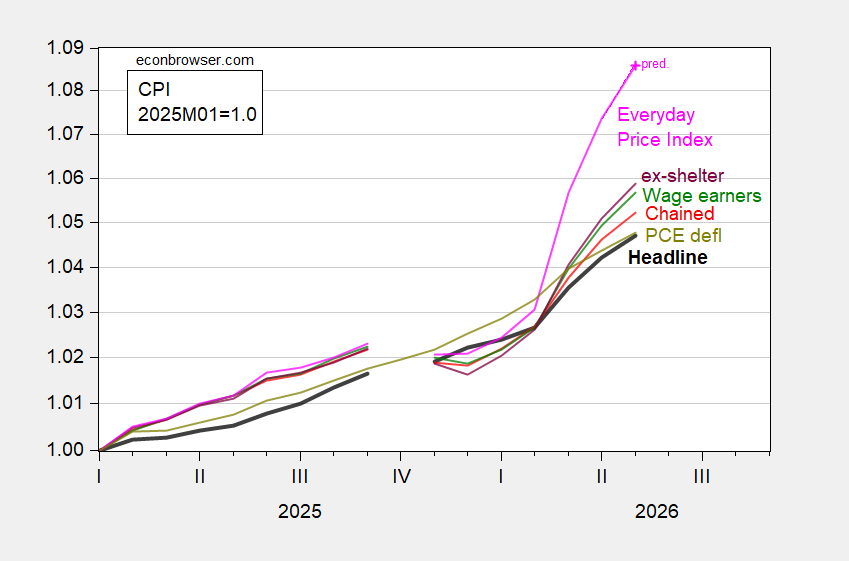
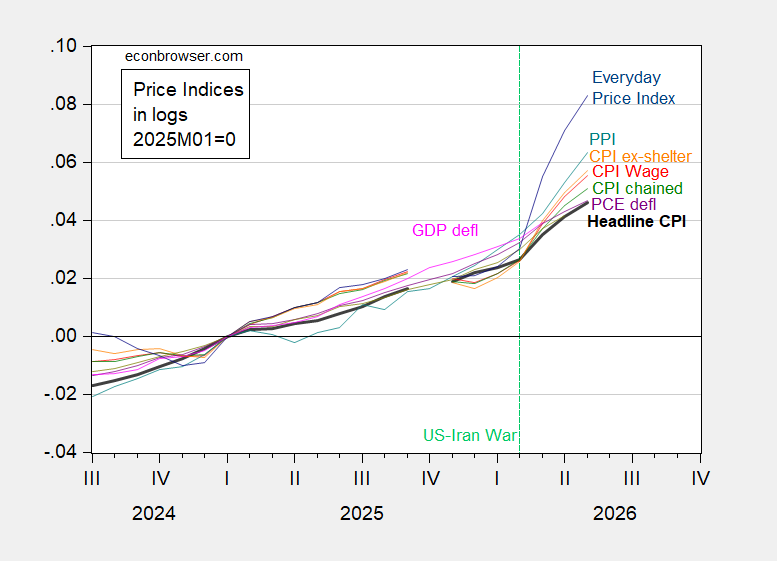
Headline CPI Inflation at Consensus, Real Wages Continue to Be Eroded
0
3