June (Final) Consumer Sentiment
Source ↗
👁 1
💬 0
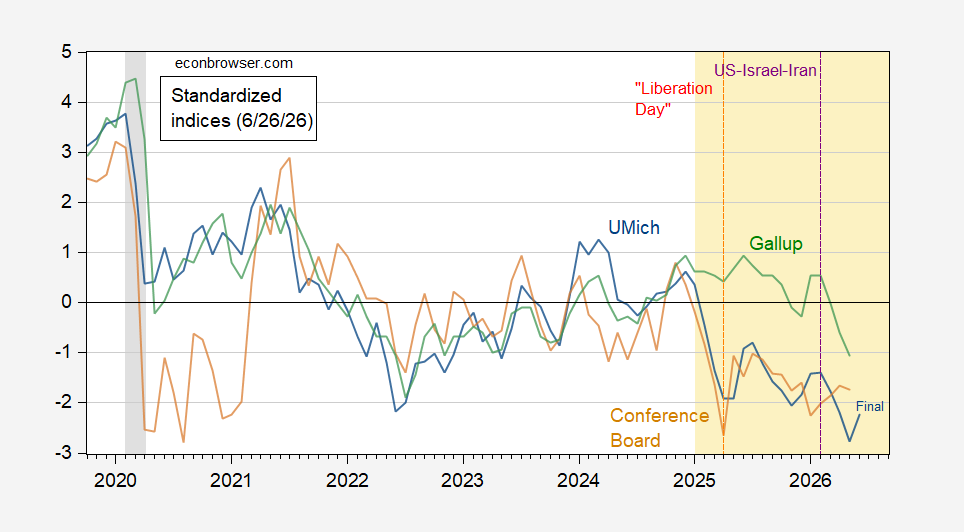
Beats consensus/preliminary (49.5 vs. 48.9), rising above May final (44.8) — but still low:
Figure 1: U.Michigan Economic Sentiment (blue), Conference Board Confidence Index (brown), Gallup Confidence (green), all demeaned and divided by standard deviation 2021M01-2025m02. NBER defined peak-to-trough recession dates shaded gray. Red dashed line at “Liberation Day”, purple at US-Israel-Iran war. Source: UMichigan, Gallup, Conference Board, and author’s calculations.
The Michigan Sentiment
Figure 1: U.Michigan Economic Sentiment (blue), Conference Board Confidence Index (brown), Gallup Confidence (green), all demeaned and divided by standard deviation 2021M01-2025m02. NBER defined peak-to-trough recession dates shaded gray. Red dashed line at “Liberation Day”, purple at US-Israel-Iran war. Source: UMichigan, Gallup, Conference Board, and author’s calculations.
The Michigan Sentiment
Comments (0)