Nonresidential Fixed Investment in the DotCom Boom/Bust
Source ↗
👁 4
💬 0
What did we think was happening back then, compared to what we know now?
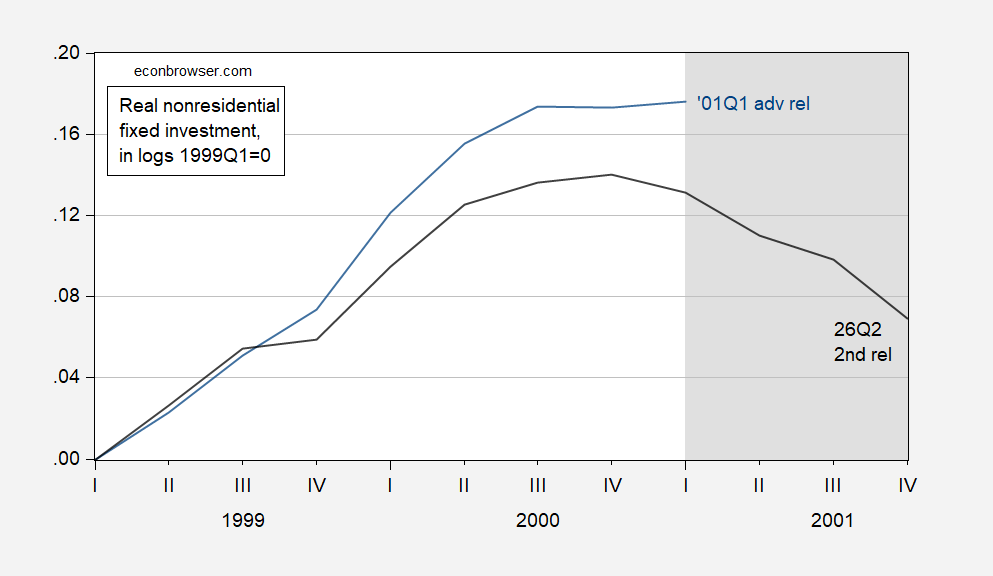
Figure 1: Nonresidential fixed investment from 2001Q1 advance release (blue), from 2026Q2 2nd release (black), both in logs, 1999Q1=0. NBER defined peak to trough recession dates shaded gray. Source: BEA, NBER.
To compare annualized growth rates, in 2000Q1, nonresidential fixed investment was growing 19.1% according to the 2001Q1 advance vintage, but only 14.4% according to the latest vintage.
Currently, 2026Q2 2nd releas
Figure 1: Nonresidential fixed investment from 2001Q1 advance release (blue), from 2026Q2 2nd release (black), both in logs, 1999Q1=0. NBER defined peak to trough recession dates shaded gray. Source: BEA, NBER.
To compare annualized growth rates, in 2000Q1, nonresidential fixed investment was growing 19.1% according to the 2001Q1 advance vintage, but only 14.4% according to the latest vintage.
Currently, 2026Q2 2nd releas



Comments (0)