ARIMA on Grocery Prices
Source ↗
👁 0
💬 0
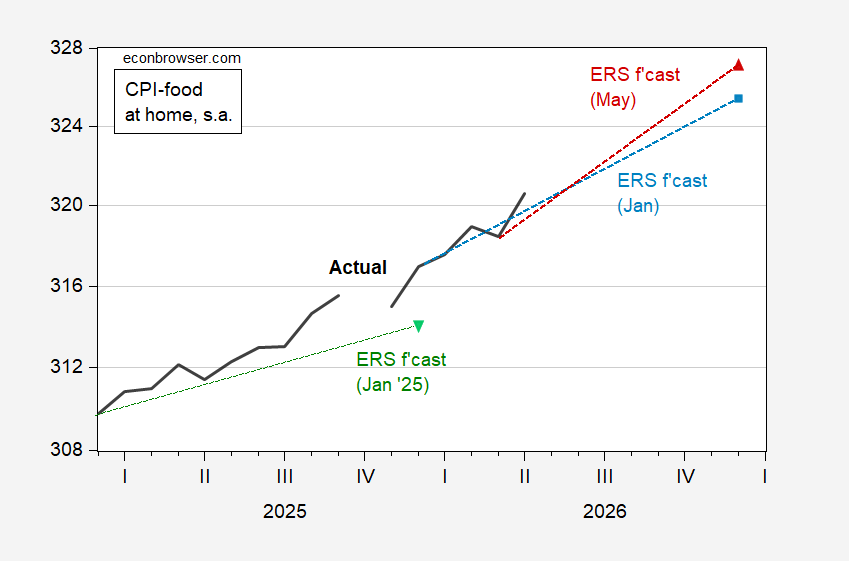
Food at home prices are outpacing the CPI.
Figure 1: CPI – food at home (black), January 2025 ERS forecast (inverted green triangle), January 2026 forecast (light blue square), May 2026 forecast (red triangle), all on log scale. Source: BLS, ERS, and author’s calculations.
Since the series are plotted against a log scale, the steepening of the trajectory for May vs. January indicates accelerating grocery price inflation. This suggests an upside surprise in 2026, following on the heels of the 2
Figure 1: CPI – food at home (black), January 2025 ERS forecast (inverted green triangle), January 2026 forecast (light blue square), May 2026 forecast (red triangle), all on log scale. Source: BLS, ERS, and author’s calculations.
Since the series are plotted against a log scale, the steepening of the trajectory for May vs. January indicates accelerating grocery price inflation. This suggests an upside surprise in 2026, following on the heels of the 2
Comments (0)