What Drives the Administration’s Trend GDP Forecast?
Source ↗
👁 0
💬 0
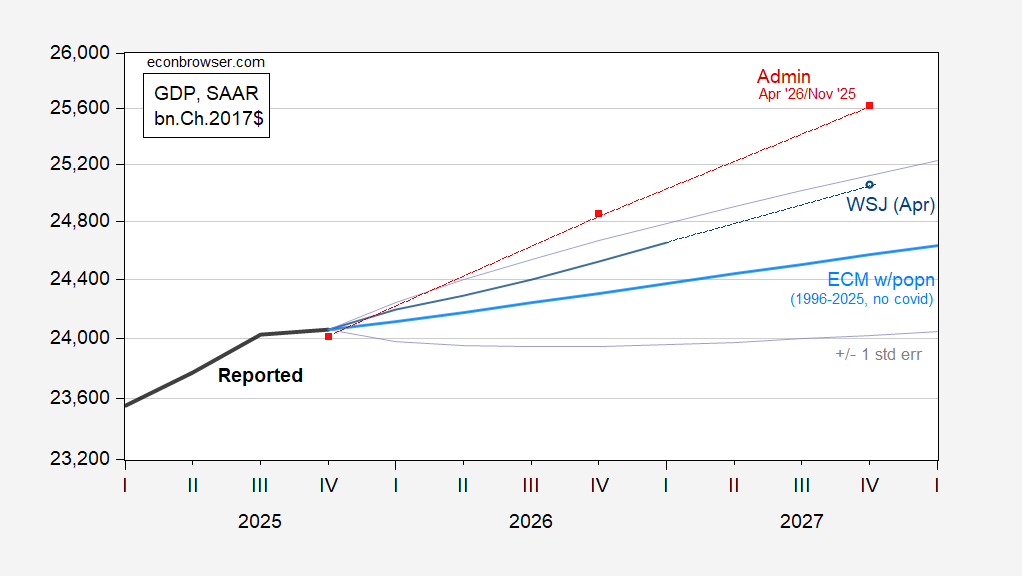
Consider this graph, comparing the Administration’s forecast to the latest WSJ forecast, and an error correction model incorporating Census population forecast.
Figure 1: Reported GDP (bold black), Administration’s forecast (red squares), WSJ April survey mean (blue), error correction model with GDP-population cointegrating vector (light blue), +/- 1 standard error band (light gray lines). Source: BEA, WSJ April survey, author’s calculations.
The Administration’s (pre-w
Comments (0)